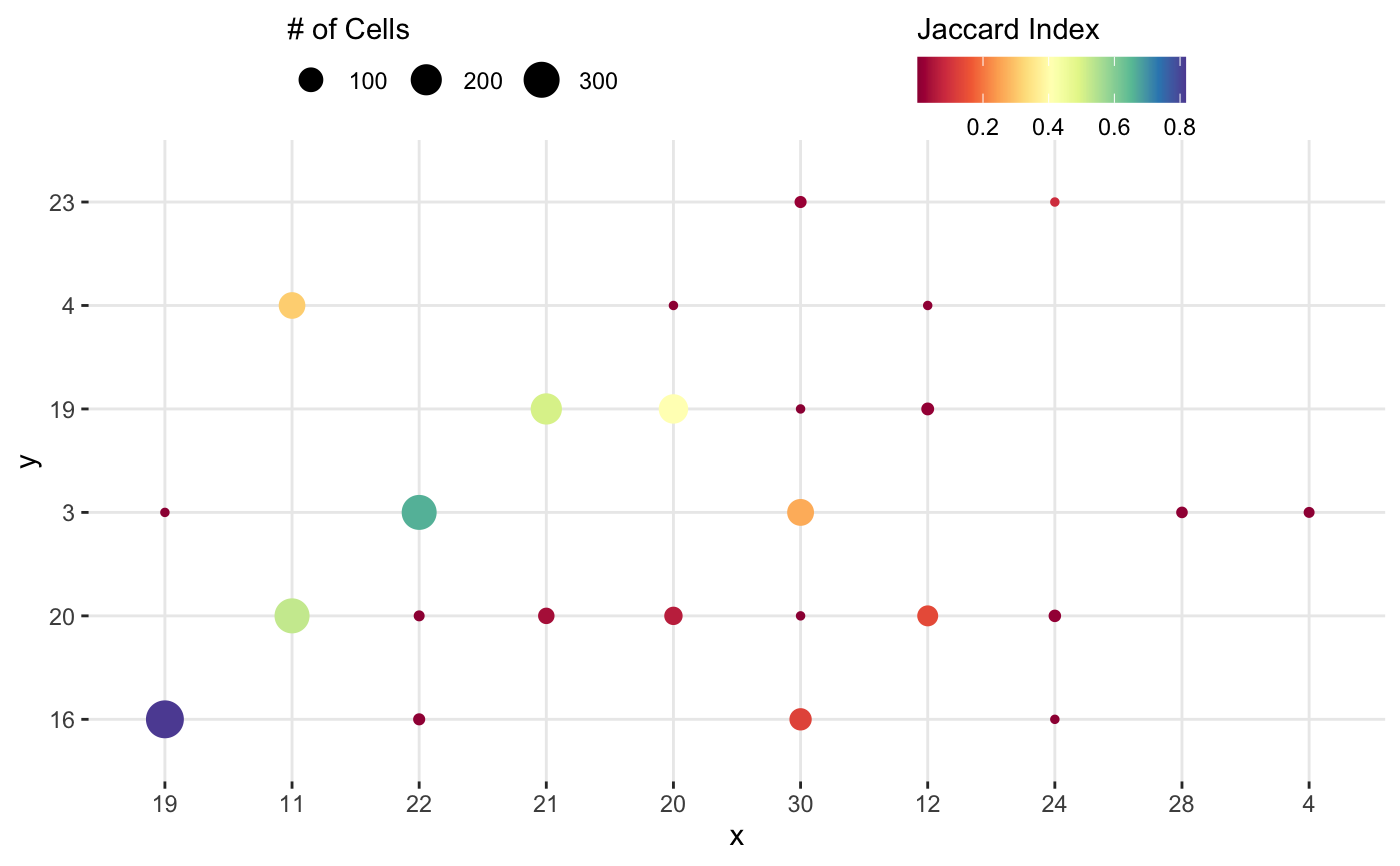
A plot to visualize how alike two clustering labels are
ConfusionPlot(x, y = NULL)
Arguments
| x |
A vector of clustering labels or a matrix of clustering labels. See details. |
| y |
Optional. Another vector of clustering labels |
Value
a ggplot object
Examples