How to use those functions
Hector Roux de Bézieux
07 April , 2020
DailyHRB.RmdInstallation
You can install this pacakge from Github using
if (!"devtools" %in% installed.packages()) {
  install.pacakges("devtools")
}
devtools::install_github("HectorRDB/DailyHRB")
Alternatively, you can download it from Github and build it from source.
Templates
This package provide two templates that I regularly use. Templates are an RStudio functionality that I find very useful to speed up project creation. To use those templates, install the package then open RStudio.
- Rmd template: Click on New File (or the “+” button), select R Markdown… in the pulldown menu. Then, select From Template and select My Template (DailyHRB).
- Project Template: Click on _New Project (or the second “+” button), select New Project. Then, select Personal Project Template.
To create similar files for yourself, the easiest way is to create your own package. Then, create a Rmd file that you want as template and create a struture similar to the int folder of the Github repo.
For the project, it ia bit more complex. It relies on the project.R file in the R folder and some other files in inst. I hope to be able to create a tutorial at some point.
Functions
my_theme
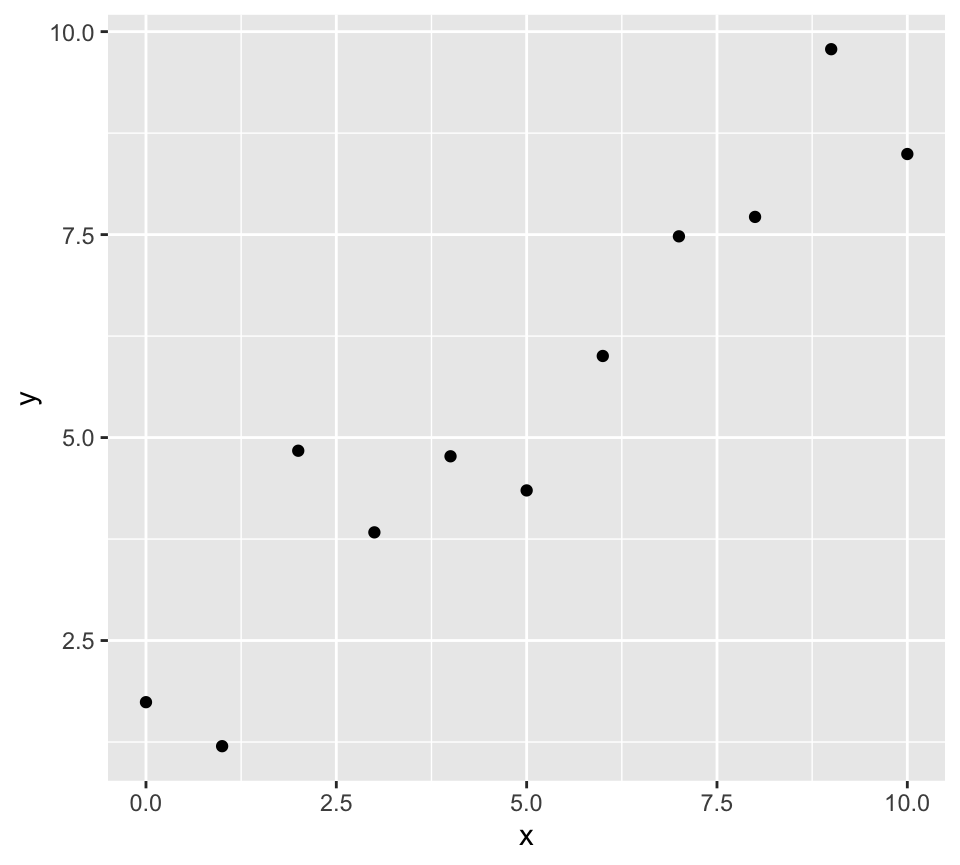
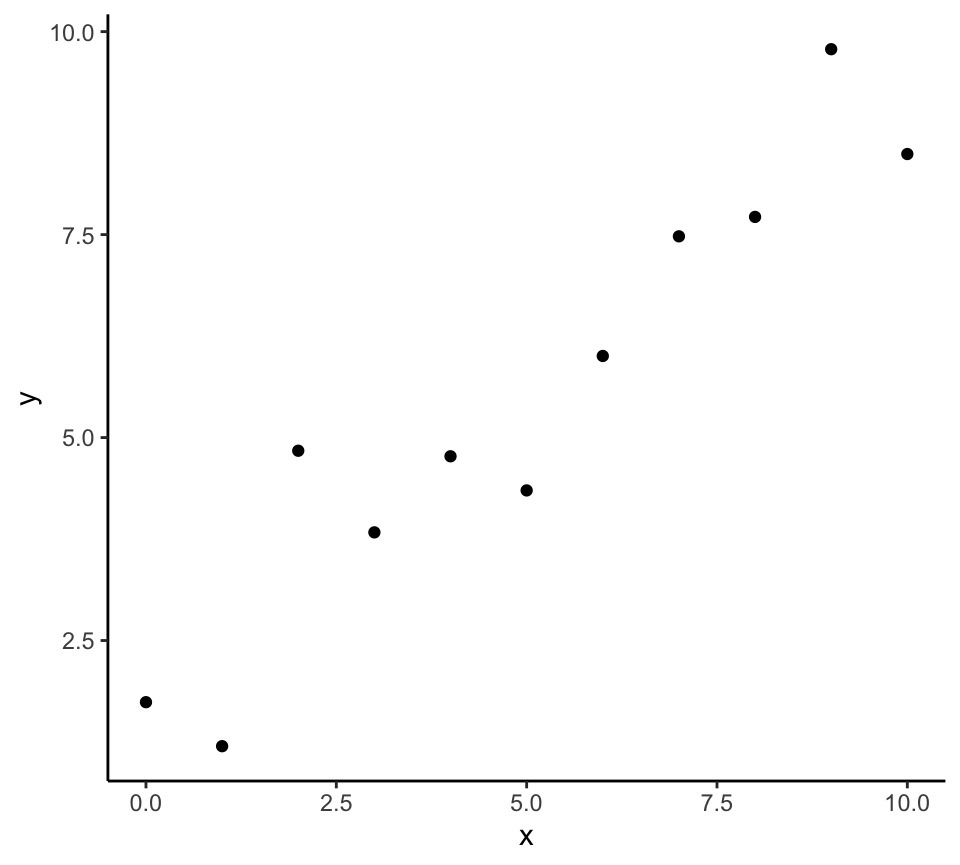
I rely a lot on ggplot2 to quickly plot nice graphs but I don’t like the deaults themes. The one I prefer is the theme_classic but it still needed some improvements. So I build a ggplot2 theme.
p <- ggplot(data.frame(x = 0:10, y = 0:10 + rnorm(11)),
       aes(x = x, y = y)) +
  geom_point()
p
p + my_theme()
ipak
This function loads the packages and install them from CRAN or Bioconductor if needed, using the BiocManager package.
## ggplot2 Biobase
##    TRUE    TRUE
checkType
This function is useful when analyzing micro-array data, RNA-Seq or scRNA-Seq data. It plots the boxplot of 10 (tunable) random columns from the input matrix. It allows to quickly see whether the data is logged and / or normalized when exploring a new dataset.
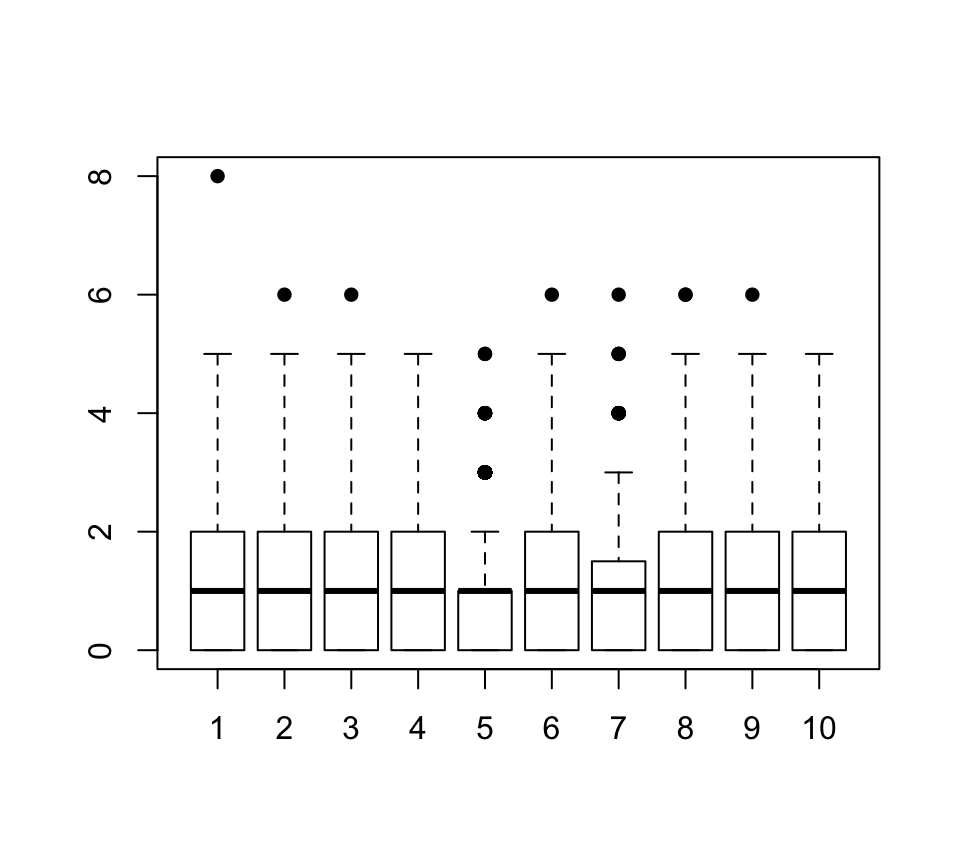
##   0%  25%  50%  75% 100%
##    0    0    1    2    8
Clean
It is a function that I use to clean metadata file, typically from SRA. It removes all columns that only have one unique value, and optionaly all columns that have no value with duplicates.
metaData <- data.frame(SRA = "SRA17CJQ1",
                       ID1 = sample(letters, 12, replace = F),
                       group = c(rep("group1", 4), rep("group2", 4), rep("group3", 4)))
metaData$ID2 <- toupper(metaData$ID1)
metaData
##          SRA ID1  group ID2
## 1  SRA17CJQ1   t group1   T
## 2  SRA17CJQ1   q group1   Q
## 3  SRA17CJQ1   b group1   B
## 4  SRA17CJQ1   h group1   H
## 5  SRA17CJQ1   n group2   N
## 6  SRA17CJQ1   o group2   O
## 7  SRA17CJQ1   e group2   E
## 8  SRA17CJQ1   k group2   K
## 9  SRA17CJQ1   z group3   Z
## 10 SRA17CJQ1   y group3   Y
## 11 SRA17CJQ1   i group3   I
## 12 SRA17CJQ1 m group3 Mclean(metaData)
##    ID1  group ID2
## 1    t group1   T
## 2    q group1   Q
## 3    b group1   B
## 4    h group1   H
## 5    n group2   N
## 6    o group2   O
## 7    e group2   E
## 8    k group2   K
## 9    z group3   Z
## 10   y group3   Y
## 11   i group3   I
## 12 m group3 Mclean(metaData, unique = F, keep = "ID1")
##     group ID1
## 1  group1   t
## 2  group1   q
## 3  group1   b
## 4  group1   h
## 5  group2   n
## 6  group2   o
## 7  group2   e
## 8  group2   k
## 9  group3   z
## 10 group3   y
## 11 group3   i
## 12 group3   m
colors
Just a shorcut, colors() is equivalent to RColorBrewer::display.brewer.all(). Setting print = TRUE will also print the names of all palettes in RColorBrewer.